How A/B Testing Increased My Revenue with 320%
With A/B Testing at TubeBuddy, you can upload two thumbnails for your Youtube video, and TubeBuddy will show them every other day on autopilot and show you which thumbnail is performing better.

On the image, you see that the right thumbnail was performing 37.2% better.
So I did this with a video where I show people how to make a website. In that video, I promoted a web hosting company. When people get web hosting through my affiliate link, I make money.
I got a few sales per month. The video was doing okay. When I started using the Split Testing feature at TubeBuddy, I found out that adding a simple red line around my Thumbnail increased the click-trough rate with 37% That means that 37% more people where clicking on my video as before.
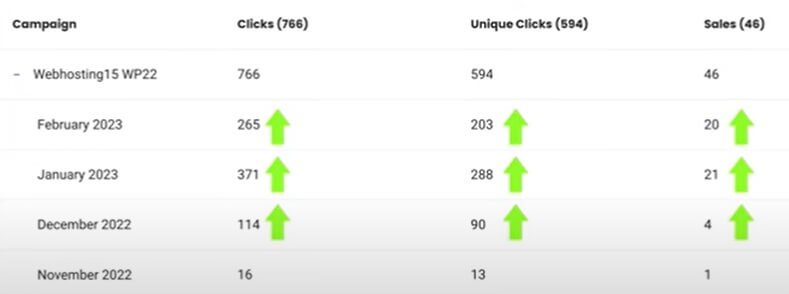
After performed the A/B Test at TubeBuddy, Sales went throughout the roof
Maybe you think: How can this give you 320% more revenue when the increase is only 37% Great question! When the click through Rate of A Video becomes higher, Youtube wants to share the video with more people. So because of the 37% increase in CTR ( Click through Rate ) I did not just get 37% more visitors, but I got 400% more visitors to my Youtube video. And in that way, I was able to increase my revenue with 320%.
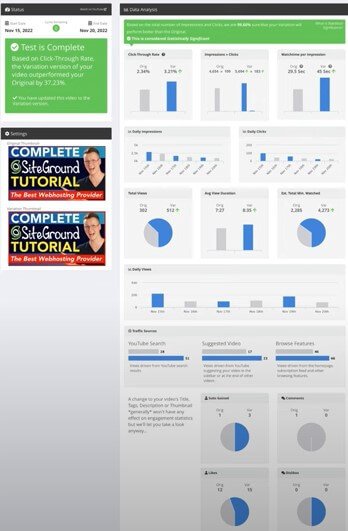
All the data TubeBuddy Gives you when performing an A/B Testing
What is A/B Testing On TubeBuddy? A/B Testing Statistic
A/B Split testing is the process of selecting two different thumbnails and letting TubeBuddy show each thumbnail every other day. When you do that TubeBuddy Keeps track of all the statistics and show you which thumbnail is performing better. These are the statistics TubeBuddy is tracking:
- Click-Through Rate
- Impressions > Clicks
- Watch timer impression
- Daily impressions
- Daily Clicks
- Total Views
- Avg. views Dution
- Estimated Total minutes watched
- Daily Views
- Youtube Search Numbers
- Suggested video Numbers
- Browse Features Numbers
- Subs Gained
- Comments
- Likes
- Dislikes
With all those statistics It can automatically helps us decide which thumbnail is performing better. In the end of the day, it will bring you a higher click-through rate, more views and more exposure on Youtube because videos with a higher click-through rate are shown more often on Youtube.
Which statistics are the most important ones?
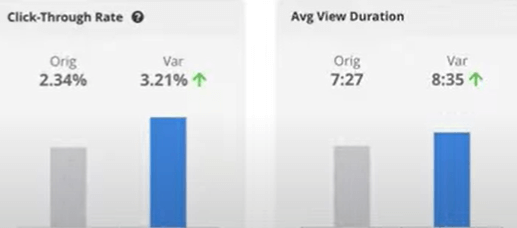
I know it looks overwhelming and exciting – all those statistics. I focus on two statistics.
- Click-through Rate
- Average view Duration
When those two are better than the original thumbnail, I have a winning Thumbnail. Why? for Youtube, Click-through rate and Average view Time are super important!
Which on is the most important? Average view duration. Youtube wants to keep the viewer on the platform as long as possible so they can make more money through ads. So if you can let viewers stay on the platform for a longer time, Youtube loves that!
How can a thumbnail increase or decrease the Average view Duration?
If i would make a thumbnail that states that people can start making $ 1,000 per day by doing something for 5 minutes. My Click-through rate would go through the roof. A high percentage would click! But when the viewers would find out it is a video about plants, they would leave the video as they click on the video.
When your thumbnail is not in line with your content, people tend to leave unless the content is better than what the thumbnail seems to tell. So getting a higher click-through rate is not hard. But it can decrease the Average view duration. When your thumbnail and content of your video are in line, you can increase you Average view duration.
The best scenario is when your new thumbnail is performing better than the original, and it is increasing the Average view duration, Then your video can start to perform a lot better, as you have seen in the case study above!
This is the best scenario: That your new thumbnail increase the CTR and the Average view duration.
Changing the title ( English translation: How To Make A WordPress Website 2025| Dutch Tutorial to How To Make A Website 2025 Increase The Click-through rate with 75% Views. So again, not only 75% more views but also more exposure from Youtube because a lot of people click on my thumbnail. Youtube promotes videos with a high Click through rate. The Average watch time was a bit better, so that is also good! If the watch time was 50% less I would not go with the variation Title.
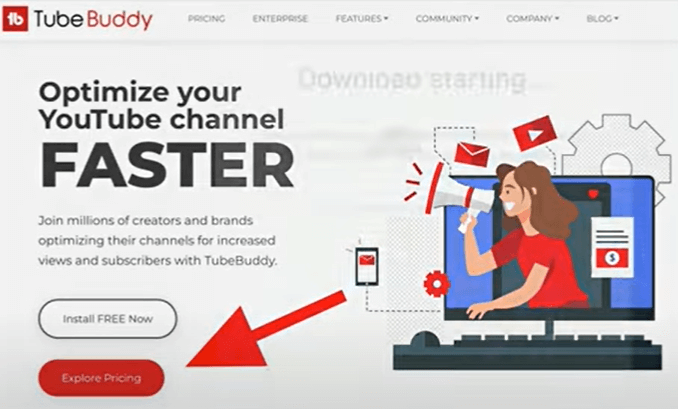
How To Get Started With TubeBuddy A/B Testing
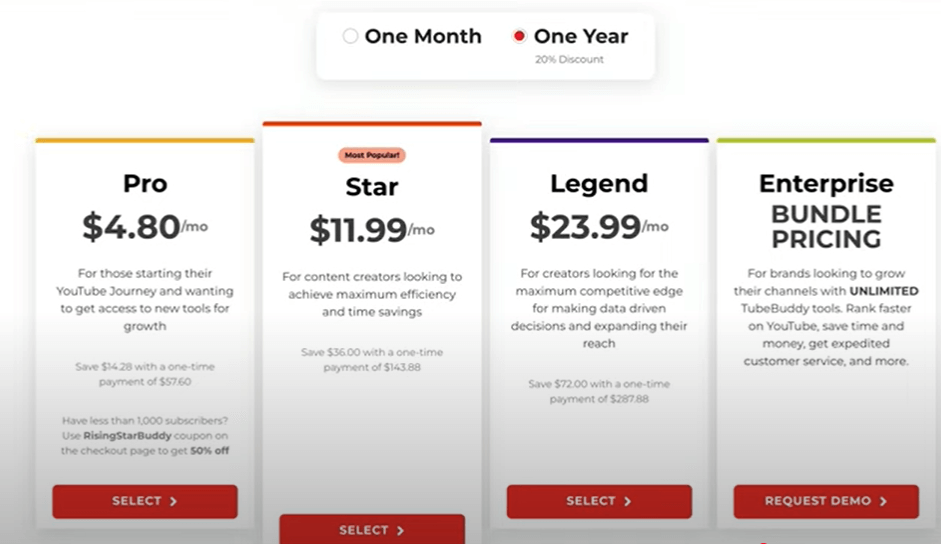
So, I hope you are excited and ready to see the results for yourself! So how to get started? You Can sign up for TubeBuddy via the button below.
Now you need to choose the legend plan because that plan enables Split Testing. Let’s do some math: when you make $30 per 1000 views on Youtube, and you have ten videos that generate 100 views per day. you will make around $30 per day. When you apply Split Testing and you increase the Click-through rate on all videos with 20%, you make %36 per day, $6 extra times 365 days = $2190 extra money per year. And then I am not even talking about getting more revies because your Click-through Rate is higher. That is why I am so excited about TubeBuddy and Solit Testing.
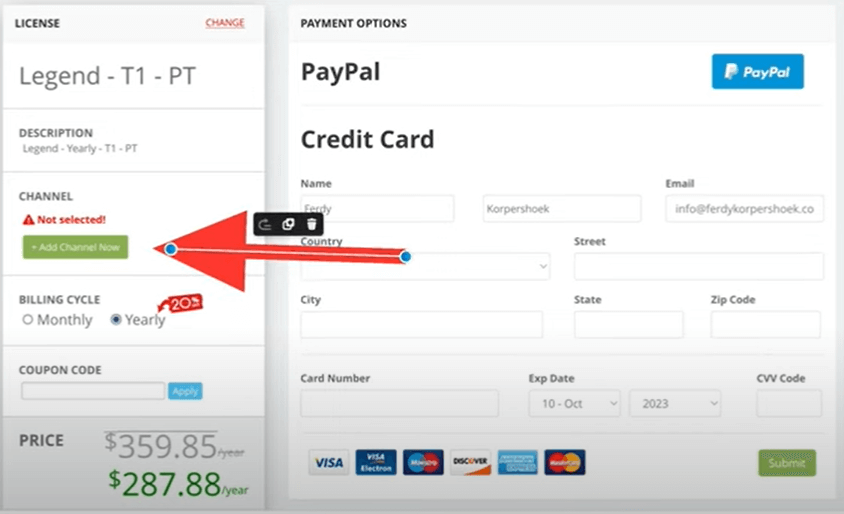
Linking Your Youtube Account (Which Is Totally Save)
After you select the legend plan, you need to link your Youtube Channel and fill in your details. You can pay with PayPal and Credit card.
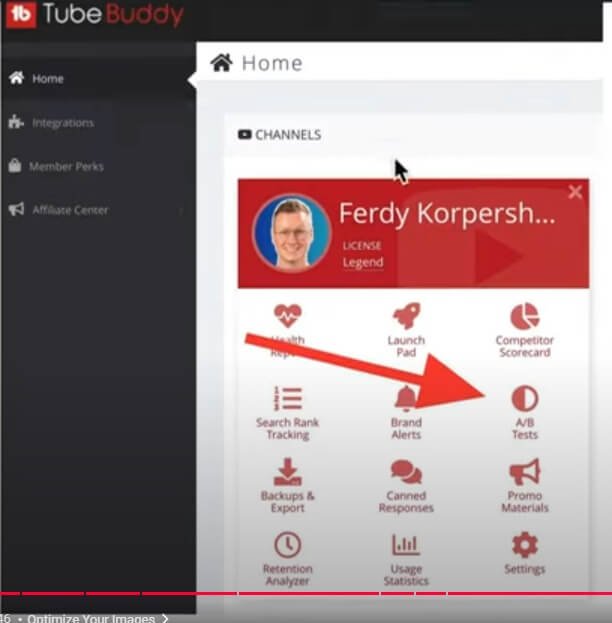
Create Your First A/B Test
Now you can start doing Split Tests. Go to Your TubeBuddy Dashboard and select A/B Tests.
Click on the green button that says : Create A/B Testing.
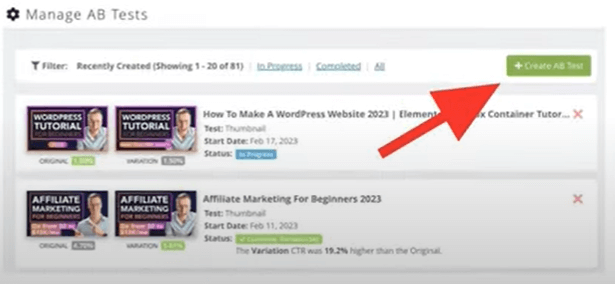
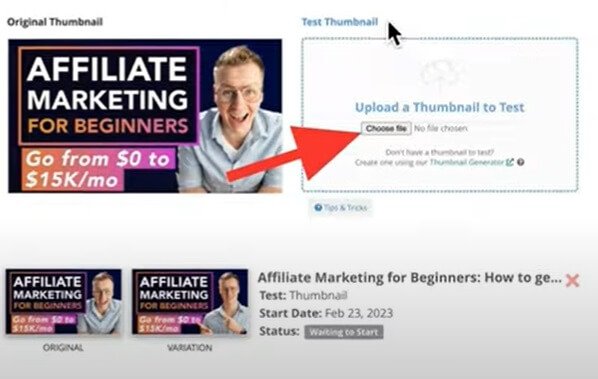
Upload the second thumbnail that you created for the Split Test. Do you yet have to create a thumbnail? You can follow this guide on how to do that using TubeBuddy.
You Can select one of your recent videos or search for a specific video by typing in the title or a keyword your video contains.
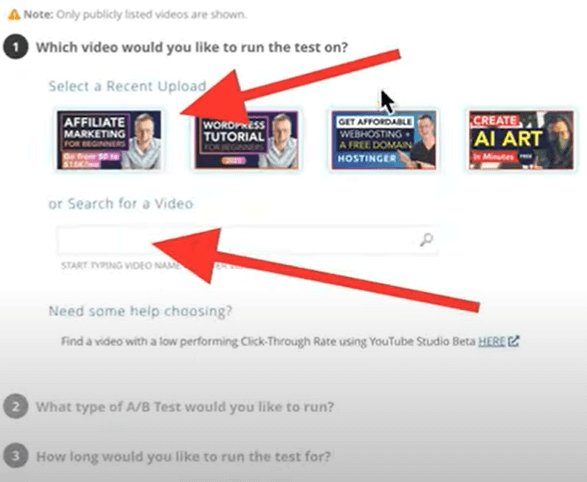
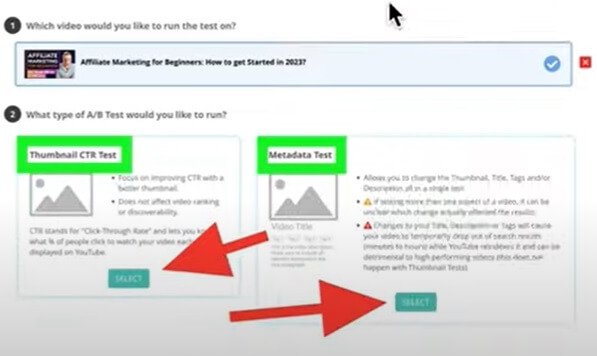
There are two types of A/B Testing.
- Thumbnails
- Metadata (Titles, Descriptions, Tags, Thumbnail)
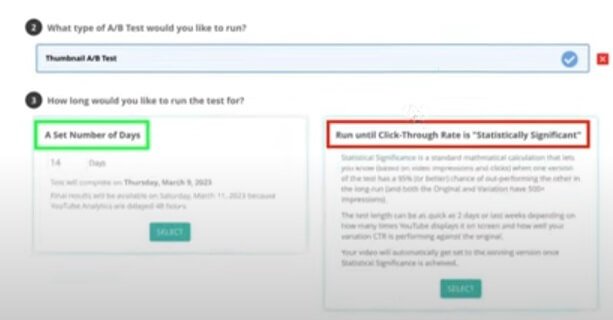
Now you can choose to run the Split test for a certain amount of days, or you run it until TubeBuddy is sure that one of the thumbnail is performing better. Never choose that option! Why? It only looks at the Click-through rate. But it is also very important to take a look at the Average View duration. If that drops drastically with a better performing Click-through rate in the eyes of TubeBuddy. It can harm the exposure of your video and give you fewer views, So always choose the Number of days. I always keep it at 14 days within 14 days you will know which thumbnail is performing better.
After selecting the 14 days option, upload the second thumbnail to TubeBuddy. Now it will work its magic! So you can sit back and relax. Every 24 hours TubeBuddy will change your thumbnail and keep track of the statistics.
Is there a maximum amount of thumbnails you can test?
There is no maximum amount of A/B Tests you can run at the same time, so I would definitely get the most out of it by creating tones of thumbnails and finding out which ones are performing better!
You can also do this with older videos! When you make this a weekly habit, you can be 100% sure that your videos will perform better!
What else can you do with TubeBuddy?
This was only one feature of TubeBuddy. But wait! There is more! Here are some other features TubeBuddy offers:
- Health Report
- Launch Pad
- Competitor Scorecard
- Search Rank Tracking
- Brand Alerts
- Backups and Exports
- Canned Responses
- Promo Materials
- Retention Analyzer
- Usage Statistics
- Reply Templates
On this website you can find more information about those topics.

Hello, It’s very nice post!
Great to hear that Ajay!!!